
Colloquium
MSDSlab Meeting 27/10/2016
This meeting was on the 27th at 14:00 in room A3.17!

We discussed the same paper, starting with a presentation by Emmeke to refresh our memory on how regression trees and random forests work. Then we went into how these were adapted to longitudinal models by the authors in the RE-EM framework.
Matthieu Brinkhuis (UD Computer Science) has joined the MSDSlab. He is also involved in the setup of new courses within the developing profile “Data Science”. Welcome, Matthieu!
Here are Emmeke’s slides about classification and regression trees (CART). This introduction was partially based on the course by Hastie and Tibshirani, the playlist of which you can find here.
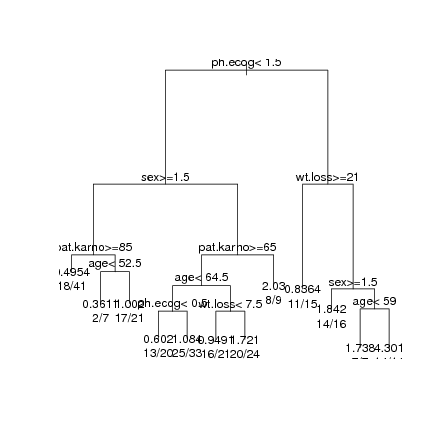
Interesting note: the vertical lines in the standard tree plots in the rpart package are related to the reduction in residual error. Longer vertical lines mean more explained variance:
We talked about bagging and boosting as methods for reduction editing the bias-variance tradeoff.
Methodology of data science
We had several “methodology takeaways” from this paper:
- It is an example of estimating one part of the model with a “classical” statistical model and another part with regression trees. It could be just an example of a larger framework! For instance, instead of RE models it could be an AR(1) correlated errors model and instead of a random forest an SVM. Or any other similar combination…
- This Machine Learning paper’s argumentation is somewhat different from the way we are used to introducing models. For example, fixed effects models are an obvious alternative but are dismissed without explanation. In the first example application this may make sense because we need to be able to predict when a new cluster (“group”) comes in. But in the second model the clusters are indeed fixed. The paper does show that the new method works better than standard RFs but does not compare with or discuss other solutions. So the situations in which this method may be more or less useful could be spelled out better, which is something methodologists/statisticians are more used to thinking about.
- The examples show a curious phenomenon that does not appear in the simulation study: the one-iteration solution is better than the >1-iteration version. This is possibly because the assumption cor(b, epsilon) = 0 is violated: in that case calculating y – Zb will inadvertently remove some variance that could have been predicted using X. This does not happen in the simulations because those are generated under the procedure’s assumption. I feel this demonstrates the usefulness of “statistical thinking” even for methods focused purely on prediction.
Playing with REEMtrees
Peter suggested it would be nice to have an example dataset we can try this method out on.
Recently I (Daniel) was involved in an EU project where the goal was to predict bee health in different countries. In a previous study called EPILOBEE, they already had collected some data on apiaries with the mortality rate, aspects of the beekeeper etc.
I thought this could be a good example, because part of this project was a pure prediction problem: predict the “winter mortality”, i.e. the proportion of colonies that died in an apiary. In reality we should use the apiary as a clustering variable but that data is not available. Instead you can use Country as a clustering variable.
I am not allowed to share these data, but using R package synthpop I have generated a fully synthetic dataset based on it with similar characteristics. It looks very similar to the real data but none of the values are real observations, they are just rows drawn randomly from a similar joint distribution (with k-anonymity at least 5). As far as I was able to tell, a linear regression gives very similar results on the synthetic and real data.
- You can download my synthetic bee data here. Or just directly (in R)
-
read.csv("http://daob.nl/files/bees_synthetic.csv")
-
Please do not share these data with others.
Next meeting
Next meeting (=next week) we will talk about SVM’s and their interpretation, led by Kees. The meeting afterwards (3 wks from now), led by Erik-Jan, will discuss slow learning/boosting.
You must be logged in to post a comment.